Yane's Site
My classwork from BIMM143
Class 12 Lab
Yane Lee PID A17670350 2026-02-16
Section 1. Proportion og G/G in a population
Downloaded a CSV file from Ensemble < https://useast.ensembl.org/Homo_sapiens/Variation/Sample?db=core;r=17:39894595-39895595;v=rs8067378;vdb=variation;vf=959672880#373531_tablePanel >
Here we read this CSV file
mxl <- read.csv("373531-SampleGenotypes-Homo_sapiens_Variation_Sample_rs8067378.csv")
head(mxl)
  Sample..Male.Female.Unknown. Genotype..forward.strand. Population.s. Father
1                  NA19648 (F)                       A|A ALL, AMR, MXL      -
2                  NA19649 (M)                       G|G ALL, AMR, MXL      -
3                  NA19651 (F)                       A|A ALL, AMR, MXL      -
4                  NA19652 (M)                       G|G ALL, AMR, MXL      -
5                  NA19654 (F)                       G|G ALL, AMR, MXL      -
6                  NA19655 (M)                       A|G ALL, AMR, MXL      -
  Mother
1      -
2      -
3      -
4      -
5      -
6      -
table(mxl$Genotype..forward.strand.)
A|A A|G G|A G|G
 22  21  12   9
round( table(mxl$Genotype..forward.strand.) / nrow(mxl) * 100, 2 )
  A|A   A|G   G|A   G|G
34.38 32.81 18.75 14.06
Now let’s look at a different population. I picked the GBR.
gbr <- read.csv("373522-SampleGenotypes-Homo_sapiens_Variation_Sample_rs8067378.csv")
Find proportion of G|G
round( table(gbr$Genotype..forward.strand.) / nrow(gbr) * 100, 2 )
  A|A   A|G   G|A   G|G
25.27 18.68 26.37 29.67
This variant that is associated with childhood asthma is more frequent in the GBR populaiton than the MXL population.
Let’s now dig into this further.
Section 4: Population Scale Analysis
One sample is obviously not enough to know what is happening in a population. You are interested in assessing genetic differences on a population scale.
So, you processed about ~230 samples and did the normalization on a genome level. Now, you want to find whether there is any association of the 4 asthma-associated SNPs (rs8067378…) on ORMDL3 expression.
How many samples do we have?
expr <- read.table("rs8067378_ENSG00000172057.6.txt")
head(expr)
   sample geno      exp
1 HG00367  A/G 28.96038
2 NA20768  A/G 20.24449
3 HG00361  A/A 31.32628
4 HG00135  A/A 34.11169
5 NA18870  G/G 18.25141
6 NA11993  A/A 32.89721
nrow(expr)
[1] 462
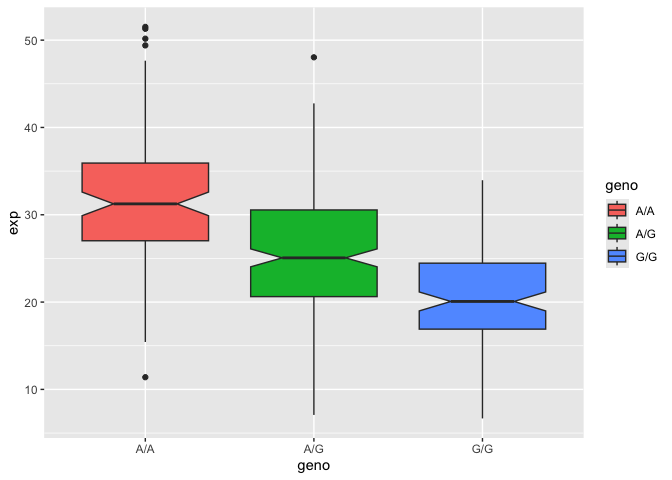
table(expr$geno)
A/A A/G G/G
108 233 121
library(ggplot2)
Let’s make a boxplot
ggplot(expr) + aes(geno, exp, fill=geno) + geom_boxplot(notch=TRUE)